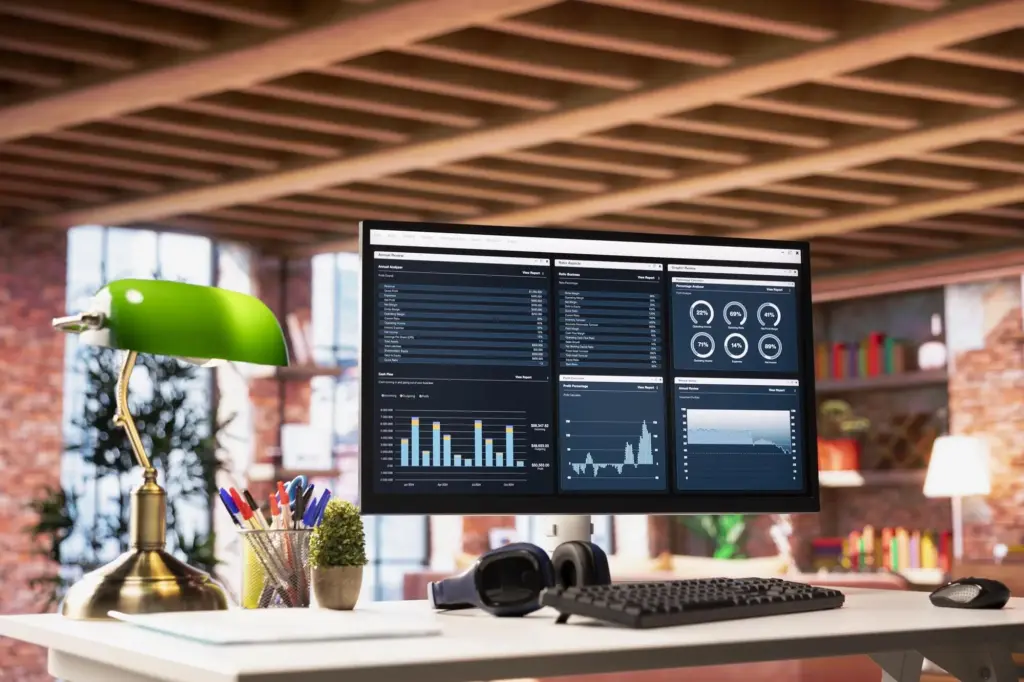
Build a Powerful Python Dashboard for Smarter Investing

Today we dive into creating an investment portfolio performance dashboard using Python and APIs, translating scattered market data into living, interactive intelligence. Together we will fetch prices, normalize currencies, compute robust returns, visualize risk and attribution, and automate reliable updates, ultimately building a practical companion that supports everyday decisions, fosters confidence, and grows alongside your investing journey.

Reliable Market Data Without Headaches

Choosing APIs that Won’t Fail on You

Mature sources like Alpha Vantage, Polygon, IEX Cloud, Yahoo Finance, and Twelve Data offer different quotas, latencies, and asset coverage. You will prioritize corporate action adjustments, dividend completeness, and intraday depth, then implement layered fallbacks, environment-based key rotation, health probes, and transparent logging. This approach keeps your portfolio calculations consistent when one provider throttles, lags, or silently changes a response format.

Taming Rate Limits and Keeping Costs Predictable

Rate limits and unpredictable costs can quietly derail great ideas. We will cache daily bars, compress historical datasets as Parquet, batch quote requests, and schedule overnight refreshes. Exponential backoff, jitter, and circuit breakers help stabilize integrations. Budget alerts, per-provider quotas, and a small local price store turn frantic spikes into calm, controlled updates that respect both your wallet and user expectations.

Cleaning Data: Dividends, Splits, and Currency

Unadjusted series obscure reality. We will adjust for splits, reinvest dividends for total-return curves, and reconcile differing corporate action methodologies across providers. Currency normalization will convert flows to a chosen base using synchronized FX rates and aligned trading calendars. By rigorously cleaning data, your performance charts stop lying, and every comparison—asset, sector, or benchmark—reflects real economic outcomes across markets.

A Solid Data Model for Portfolios and Holdings

Transactions First: Truth You Can Recompute From

Start with atomic events—buys, sells, dividends, interest, fees, and transfers—rather than fragile end-of-day balances. From these, deterministically derive positions, costs, and realized gains. Maintain consistent identifiers, robust timestamps, and currency tags. When a broker revises a file or you discover a split, you can replay history confidently, create corrected snapshots, and preserve a clear audit trail for every calculated metric.

Return Calculations that Match Reality

We will implement time-weighted return for manager skill, money-weighted return (IRR) to reflect investor cash timing, and rolling horizon CAGR to contextualize compounding. Deposits, withdrawals, and fees are segmented precisely. Daily partitioning protects against irregular cash flows, while holiday-aware calendars prevent phantom returns. Clear documentation and unit tests ensure numbers agree with spreadsheets, statements, and expectations during real-world reconciliations.

Benchmarking and Multi-Currency Design

Benchmarking is meaningful only when normalized. We will track indices such as SPY, ACWI, or bond aggregates with matching frequencies and calendars, convert them into your base currency, and align their corporate actions. Multi-currency portfolios gain per-asset FX attribution, so you can separate investment skill from currency winds. Thoughtful keys and joins keep cross-asset comparisons correct and reproducible.

Turning Numbers into Insightful Visuals

Plotly Tricks for Finance Clarity

Details matter: log scales reveal compounding, hover templates explain datapoints, and range sliders make history navigable. Secondary axes compare assets and benchmarks without confusion. Annotations flag rebalances and deposits. Candlesticks, area charts, and heatmaps each earn their place, chosen to answer a question. Small design upgrades translate into swift, confident interpretation when markets move faster than attention.

Streamlit or Dash: Pick Your Path

Streamlit offers rapid iteration with simple stateful widgets and delightful defaults, perfect for solo builders or small teams. Dash provides fine-grained callbacks, larger-scale modularity, and polished multi-page experiences. We will consider hosting options, session performance, secrets management, and organizational needs. Whichever path you choose, your interface will feel welcoming, fast, and purpose-built for everyday portfolio decisions.

Designing for Decisions, Not Decoration

A great dashboard reduces hesitation. We will highlight actionable insights: allocations outside policy bands, deep drawdowns exceeding comfort levels, cash buffers below targets, and assets driving unexpected risk. Filters remember preferences, empty states teach gently, and comparisons default sensibly. By aligning visuals with investor jobs-to-be-done, beauty becomes a byproduct of clarity, not a distraction from consequential choices.

Risk, Attribution, and What Really Drove Results

Understanding performance requires more than green lines. We will compute volatility, Sharpe, Sortino, maximum drawdown, beta, alpha, and tracking error, then pair them with Brinson-style attribution separating allocation and selection effects. With these lenses, brief rallies and painful slumps become teachable narratives, guiding allocation policy, rebalancing discipline, and the emotional resilience demanded by real capital at work.

ETL on Autopilot with Robust Safeguards

Automated jobs fetch prices, FX rates, and benchmarks, then validate shapes, ranges, and freshness before publishing. Checkpoints and hashing detect partial files or corrupted payloads. Alerting channels announce anomalies with context, not panic. When idempotency rules and retries are first-class citizens, your daily refreshes gain the calm predictability that makes insights trustworthy instead of sporadically impressive.

Testing Financial Logic Before It Touches Money

We will codify edge cases—odd-lot splits, same-day cash flows, missing dividends, and month-ends crossing holidays—into unit and property tests. Golden datasets anchor expectations. Precision pitfalls get caught early with tolerance bands. By promoting testable functions and clear contracts, you keep surprises out of production and build the quiet confidence that encourages broader adoption across stakeholders.

Shipping Securely and Smoothly

Package with Poetry or pip-tools, containerize with Docker, and propagate configurations safely via environment variables or secret stores. Deploy on Render, Railway, cloud instances, or internal servers with HTTPS and role-based access. Migrations preserve data integrity, while rolling updates limit downtime. Small operational niceties compound into an experience people trust implicitly, even when markets feel chaotic.

Stories from the First Real Users

A friend launched the dashboard for a family portfolio and noticed anxiety drop during volatile weeks. Seeing drawdown context, allocation drift, and actionable notices replaced frantic messages with calm check-ins. Their feedback—clearer benchmark labeling and gentler color contrasts—shaped the next release. Real stories sharpen priorities better than abstract requirements or internal debates about personal preferences.

Make It Personal with Notifications and Nudges

Timely nudges transform insight into action. Email, Slack, or webhook alerts can flag policy band breaches, new dividend postings, unusual tracking error, or large cash balances. Preferences tailor frequency and thresholds. Digest summaries arrive when attention is available. Gentle, helpful messages respect cognitive load, encouraging steady habits rather than dramatic, last-minute scrambles to catch up.

Join the Journey and Shape What Comes Next

Your perspective matters. Share questions, request metrics, suggest visual improvements, and report confusing moments. Subscribe for concise release notes and early previews. If you are comfortable, contribute anonymized holdings structures for testing better edge cases. Together we can refine calculations, polish interactions, and grow a dashboard that feels uniquely helpful to long-term investors navigating uncertainty with clarity.

Vexotelitaripirasentonilo
Privacy Overview

This website uses cookies so that we can provide you with the best user experience possible. Cookie information is stored in your browser and performs functions such as recognising you when you return to our website and helping our team to understand which sections of the website you find most interesting and useful.